19 Results
View results:
Sort by:
To evaluate whether it is also necessary to consider the second-order analysis in a dynamic calculation, the sensitivity coefficient of interstory drift θ is provided in EN 1998‑1, Sections 2.2.2 and 4.4.2.2. It can be calculated and analyzed using RFEM 6 and RSTAB 9.
The coefficient θ is calculated as follows:$$\mathrm\theta\;=\;\frac{\displaystyle{\mathrm P}_\mathrm{tot}\;\cdot\;{\mathrm d}_\mathrm r}{{\mathrm V}_\mathrm{tot}\;\cdot\;\mathrm h}\;$$
The coefficient θ is calculated as follows:$$\mathrm\theta\;=\;\frac{\displaystyle{\mathrm P}_\mathrm{tot}\;\cdot\;{\mathrm d}_\mathrm r}{{\mathrm V}_\mathrm{tot}\;\cdot\;\mathrm h}\;$$
For the ultimate limit state design, EN 1998‑1, Sections 2.2.2 and 4.4.2.2 require a calculation considering the second‑order theory (P‑Δ effect). This effect may be neglected only if the interstory drift sensitivity coefficient θ is less than 0.1.
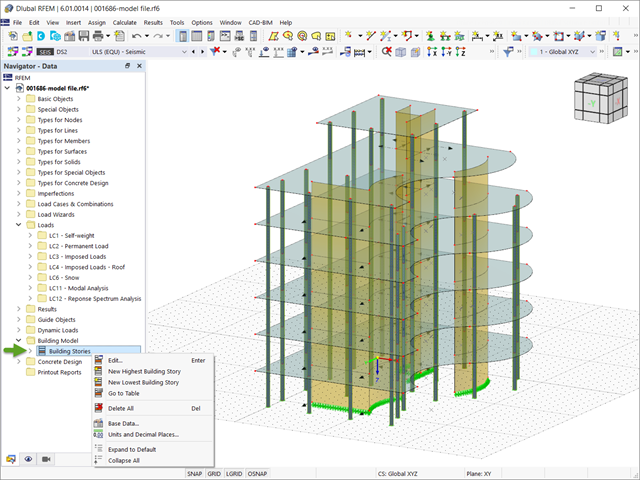
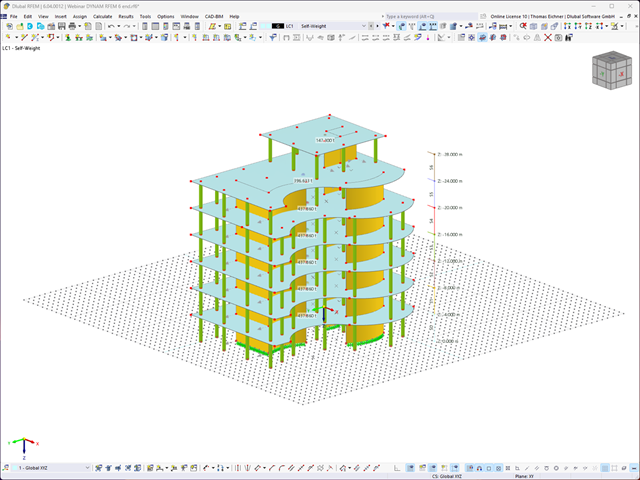
In RFEM 6, seismic analysis can be done by using the Modal Analysis and the Response Spectrum Analysis add-ons. Once the spectral analysis has been performed, it is possible to use the Building Model add-on to display story actions, interstory drifts, and forces in shear walls.
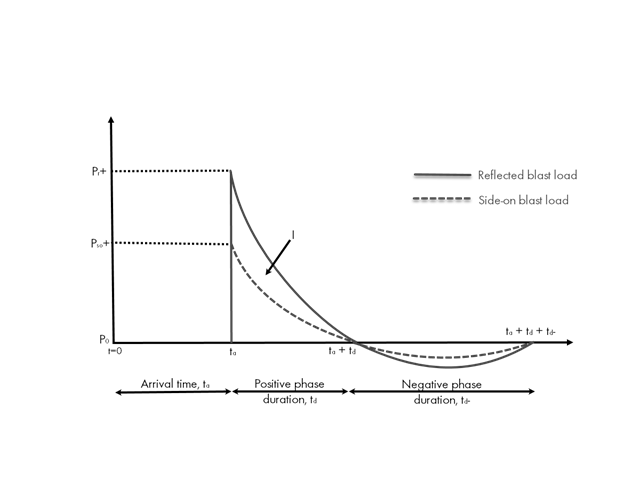
Blast loads from high-energy explosives, either accidental or intentional, are rare but may be a structural design requirement. These dynamic loads differ from standard static loads due to their large magnitude and very short duration. A blast scenario can be carried out directly in an FEA program as a time history analysis to minimize loss of life and evaluate varying levels of structural damage.
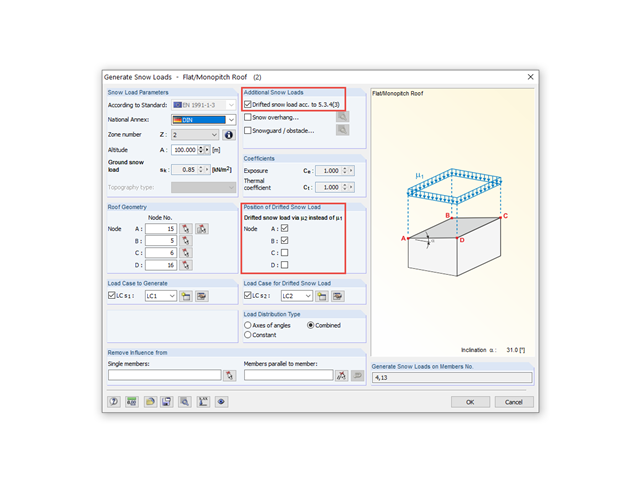
In RFEM and RSTAB, snow drift is considered according to 5.3.4(3) of DIN EN 1991‑1‑3 for saw-tooth roofs.
In this article, representations of a blast scenario of a remote detonation performed in RF-DYNAM Pro - Forced Vibrations are shown, and the effects are compared in the linear time history analysis.
This technical article analyzes the effects of the connection stiffness on the determination of internal forces, as well as the design of connections using the example of a two-story, double-spanned steel frame.
With the RF-STABILITY and RSBUCK add-on modules for RFEM and RSTAB, it is possible to perform eigenvalue analyses for member structures in order to determine the effective length factors. The effective length coefficients can then be used for the stability design.
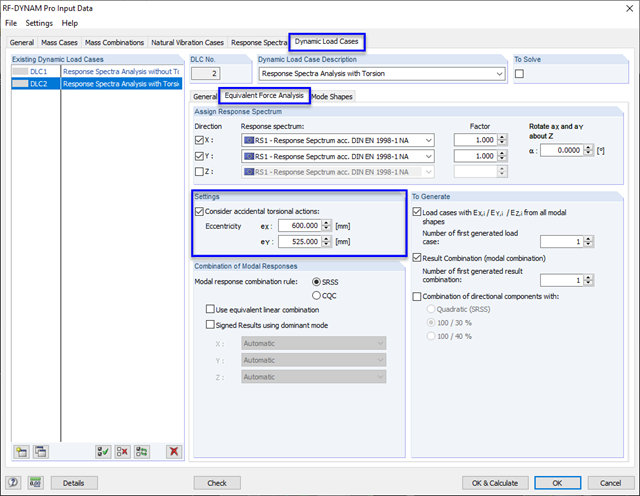
In order to consider inaccuracies regarding the position of masses in a response spectrum analysis, standards for seismic design specify rules that have to be applied in both the simplified and multi-modal response spectrum analyses. These rules describe the following general procedure: The story mass must be shifted by a certain eccentricity, which results in a torsional moment.
When introducing and transferring horizontal loads such as wind or seismic loads, increasing difficulties arise in 3D models. To avoid such issues, some standards (for example, ASCE 7, NBC) require the simplification of the model using diaphragms that distribute the horizontal loads to structural components transferring loads, but cannot transfer bending themselves (called "Diaphragm").
Numerous nonlinearities can occur in a structural system. The RF-DYNAM Pro - Nonlinear Time History add-on module was developed in order to model them realistically in a dynamic analysis. To explain how the add-on module works, the procedure is described below with an example.
The story drift of a building provides valuable information about its structural behavior under seismic loads. These could cause large horizontal deformations and even instabilities. Some standards, therefore, call for a check of the story drift in its center of gravity. It indicates, for example, if a second-order analysis (P-Δ effect) is necessary.
In RF-DYNAM Pro - Equivalent Loads, the equivalent seismic loads can be calculated according to different standards. By calculating the equivalent loads for each eigenmode, it is not directly possible to obtain the transversal shear for each story to perform an analysis afterwards. The following example describes the option to calculate the transversal shear quickly and efficiently.
Wind is the only climatic load acting on every type of structure in every country in the world, unlike snow. The wind speed depends on the geographic location of the building. Currently, this is one of the main reasons for the necessity of regional division (wind zone) and consideration of the altitude stipulated within the official standards; the variation of the dynamic pressures according to the height above the ground for a "normal" site deprived of masking effect should be taken into account as well.
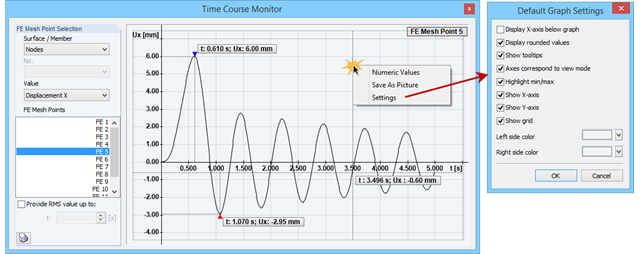
The Time Course Monitor displays the results of a time history analysis from RF‑/DYNAM Pro – Forced Vibrations. The graphic can be adjusted in the settings. This can be reached by right-clicking in the shortcut menu. For example, you can activate or deactivate the grid in the graphic. Those changes are overtaken into the printout report when you print the graphic.
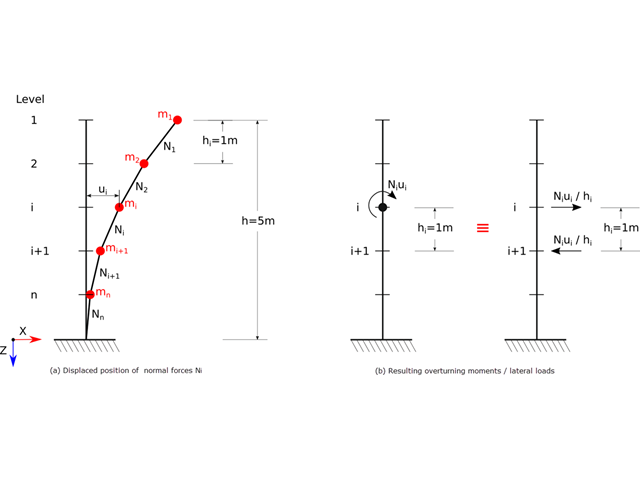
![Reduction of Building to Cantilever Structure: The individual mass points represent the floors. The deflection due to the normal compression forces shown in (a) is (b) converted into equivalent moments of displacement or shear forces [2].](/en/webimage/009762/2420261/01-en-png-12-png.png?mw=640&hash=2753cb61c54a78756b34fd3ab03c92ed01b9fd39)
For the ultimate limit state design, EN 1998 1, Sections 2.2.2 and 4.4.2.2 [1], requires the calculation considering the second-order theory (P-Δ effect). This effect may be neglected only if the interstory drift sensitivity coefficient θ is less than 0.1. The coefficient θ is defined as follows:
$$\mathrm\theta\;=\;\frac{\displaystyle{\mathrm P}_\mathrm{tot}\;\cdot\;{\mathrm d}_\mathrm r }{{\mathrm V}_\mathrm{tot}\;\cdot\;\mathrm h}\;(1)$$
where
θ is the interstory drift sensitivity coefficient,
Ptot is the total gravity load at and above the story considered in the seismic design situation (see Expression 2),
dr is the design interstory drift, evaluated as the difference of the average lateral displacements dS at the top and bottom of the story under consideration; for this, the displacement is determined using the linear design response spectrum with q = 1.0,
Vtot is the total seismic story shear determined using the linear design response spectrum,
h is the interstory height.
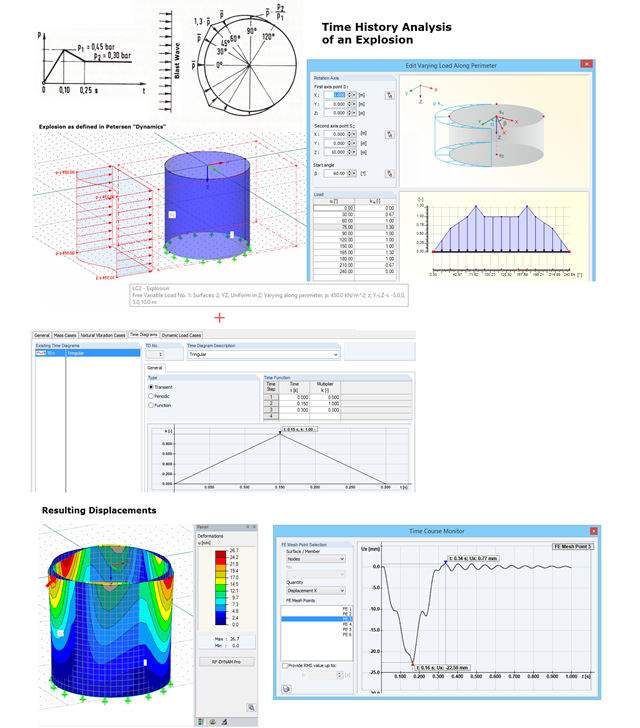
With RF-DYNAM Pro – Forced Vibrations, you can perform a time history analysis. For example, you can analyze an explosion acting on a nearby building structure. In "Dynamik der Baukonstruktionen" by Christian Petersen, formulas for time diagrams and load distribution are described to specify an explosion. The image shows the input of such an explosion load. Free variable loads are available in RFEM that enable flexible load distributions.
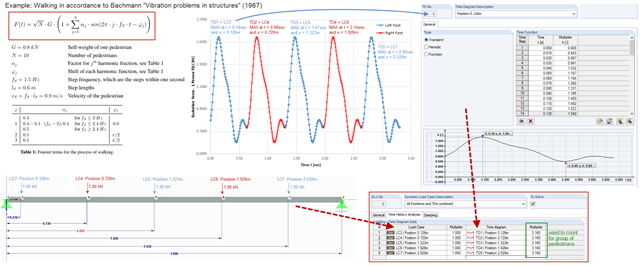
To simulate an excitation that varies over time and changes its position, you can combine several loading time diagrams in RF‑/DYNAM Pro - Forced Vibrations.
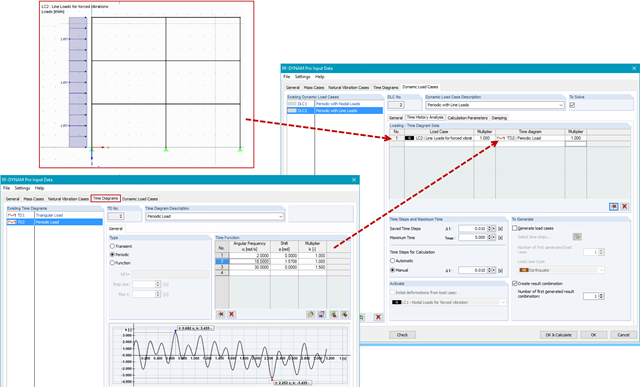
In RF-/DYNAM Pro - Forced Vibrations, you combine static load cases with time diagrams to define the type of excitation of your structure. This way, you can use not only nodal loads, but also use line, surface, free, or generated loads in the time history analysis.